Serengeti - the Living Data Project
Dr. Tony Sinclair is Professor Emeritus and the former Director of the Biodiversity Research Centre at UBC. He has been studying the ecology of Serengeti for decades and has accumulated a wealth of data on animal populations through time. With Biodiversity Research Centre students Pierre Rogy and Francisco Henao Diaz, the data on bird and ungulate populations is now openly accessible in a format that will allow the information to be used in scientific studies well into the future.
Read about my research.
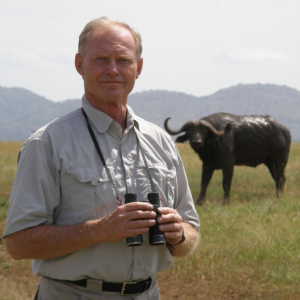
The single most important problem in the world today is the destruction that human populations are causing to the environment. In order to see whether this destruction is going to push us into a position which we don't want—to be in an irreversible state—we have to be able to monitor what's happening. And in order to do that we have to have a baseline against which we can compare changes. And that baseline has to be in two particular areas: one where human interference is at a minimum, and the other where human interference is at a maximum. And probably the most important interference that humans have on the environment is agriculture. I'm Tony Sinclair, I was the first director of the Biodiversity Research Centre and now professor emeritus, I have worked in Serengeti for the last 50 years and this is the account of what we did with the data.
In nature, our controls are the protected areas and we then compare that with places outside protected areas. We need both data at a starting point and then we need to be able to monitor change. And to do that requires keeping data going over a very long period of time. Initially we set out to do that by collecting a data set, a baseline data set, with the intention that somebody else in 50 or 100 years time would do the same thing and see what changes have taken place. As it turned out, after 50 years we were already seeing within our own data major changes that were taking place naturally within the control area and were able to compare that with other changes that were taking place outside. There were two sets of data that we used here: one was recording birds and the other was recording the age structure of the ungulates, the large mammals. In both cases we did this by driving transects along roads, at about—somewhere between 30 and 50 kilometres an hour, and, for the birds, calling out as we saw them. The recorder put them down on paper, which was on clipboards, and then afterwards had to transcribe that into the computer. And so that became the basically the raw data in in the computer database.
This then was turned into a data set that we had to envisage was possible to understand in 50 or 100 years time. Hi, I'm Pierre Rogy, I'm a third year PhD student in the Srivastava Lab at UBC and I worked with Tony on the undulate dataset. So basically the data was given to me by Tony in Excel format, but the problem with Excel is that it's it's not a public format, so you need a license to be able to use and read the format, and also it may not be around in 50 years. So what I did was check the data using R and making sure everything is all right, combining all the files—because I got a file for each different species—combining everything into one, and then rewriting the file in text format which is much more general, it can be used by by anyone.
The major challenge was how to synthesize or how to bring everything together but still keeping it clear and understandable. I'm Francisco Henao Diaz, I'm a PhD student at UBC with Matt Pennell and I work with phylogenetics and biogeography. I work with the bird dataset from the Serengeti, I got different tables that were stored in Excel but they were previously worked on in Access—that was another type of a dataset format—many of them they were kind of related through some of the acronyms, some of the, like the GPS tags that were used to georeference the recordings and the places. We had three different types of samplings: points, transects, and also some ad-hoc information. One of the big challenges is the same thing, it's like trying to put all the information together or make it comprehensible, keep the integrity of the data—as much data as you can—but also try to see, or try to forecast, how this data might be used even like 50 or 60 years from now. So try to get the best thing from the past, try to integrate it now, and try to see in the future, while having the opportunity to interact with Tony. So that was kind of the interesting thing of this dataset.
Once Pierre and Francisco had cleaned up the data—and there were actually transcription errors and other sorts of errors as well—I was then able to start doing some analyses which started showing up all sorts of interesting results. For example, in the bird data, I have now been able to look at the changes over time and compare that with changes in climate, with respect to the problem of climate change. We have the interesting situation in Serengeti that climate is affected by El Niño. El Niño, based on changes in this in the Pacific Ocean sea surface temperatures, eventually affects the ecology of Serengeti. We have got very strong data to show that therefore we have fluctuations in the climate due to El Niño which we can then use to predict what would happen when climate change say, doubles the rainfall, or halves the rainfall, now that we have got this into a position that this can work. So we were not expecting that to be able to deal with the climate changes issue at this point but I have just put this together now and realized that the signal is already coming out.
We hope in the future that a similar data collection will be conducted—doesn't require doing it all the time—let's say wait another two decades and then do it again. That will provide the indicators that we urgently need to see what's happening.